
Custom dashboard widgets from SVG files
The dashboards introduced recently come with a set of built-in components: gauges, switches, tanks, pumps, and so on. Simple IoT can now also draw your own SVG files as dashboard widgets, so the graphics on a dashboard can be whatever your equipment needs.
The video demo starts with a blank system and imports the custom widget demo from the source tree:
siot import < testdata/custom-widget-demo.yamlThis adds a group of variables, signal generators, and dashboards. It also adds a handful of file nodes, each holding an SVG drawing. Every widget on the demo dashboard is drawn by one of those files.
How a widget binds to data
Setting one up takes two steps. Add a widget, pick the svg component, and point it at the file node that holds the drawing. You can view and edit the SVG contents in the browser, or upload a new file.
Inside the SVG, data-siot-* attributes on elements declare what follows a node
value. The demo’s pump drawing declares two bindings, running and speed. When
you add the widget, SIOT lists every binding the drawing declares, and you bind
each one to a node. The pump’s running binding is bound to the same pump command
variable as the switches on the dashboard, so flipping a switch starts and stops
the pump graphic.
There is not much more to it than that. The dashboards guide lists the attributes: text with decimals and units, rotation for dials, level for vessels, toggle and set for clickable controls, and ports so links on a canvas can attach to the drawing.
Creating a new widget with AI
The SVG files are short and simple, but writing one by hand means working out
coordinates and element positions, which is tedious. The source tree includes
several Claude Code skills, and the siot-build skill knows how to build
dashboards and widgets.
In the video, I ask Claude to create a blank canvas dashboard named Rover, and then to add a widget for an autonomous off-road rover with four-wheel drive, turning wheels, and separate front and rear drive controls. A few minutes later there is a rover on the dashboard.
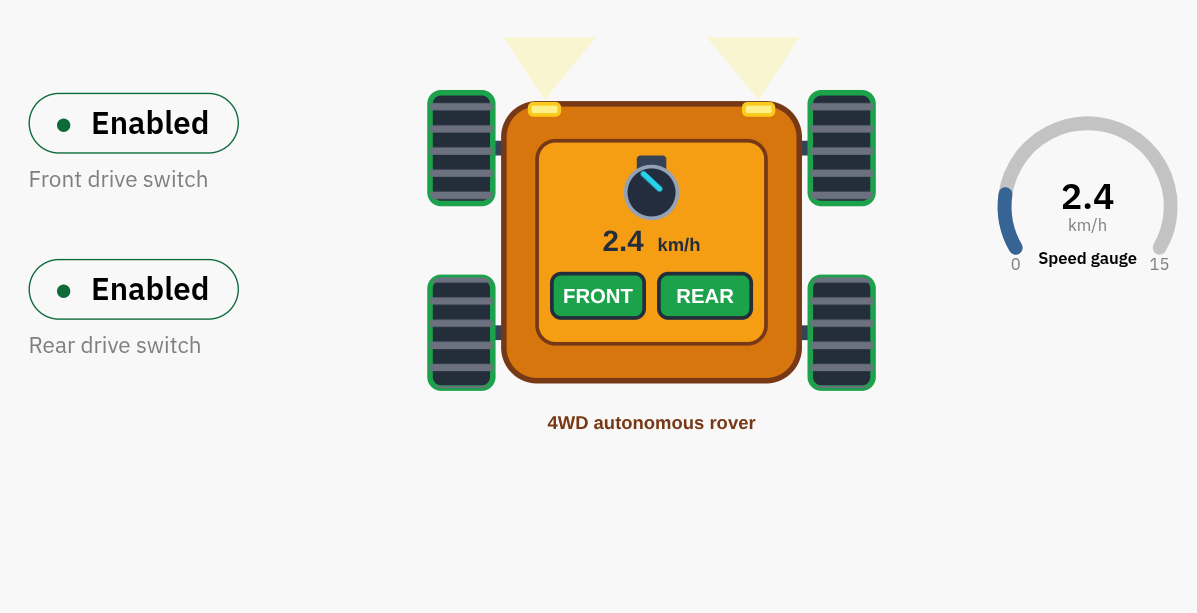
The front and rear wheels can be started from the switches beside the widget, or from the buttons drawn inside it. Stop the wheels, and the speed drops to zero right away.
The demos so far have been industrial control applications. This one is different, perhaps monitoring an autonomous vehicle, and that is the point. Simple IoT is for rich, real-time interaction with any kind of equipment, and custom widgets let you draw graphics that clearly show what the equipment is doing.
Thoughts, questions, feedback, let me know.