
Dashboards that sync like everything else
Simple IoT now has dashboards. This continues the SIOT tradition of rich, real-time interaction with remote devices and extends it from sensor data and configuration to the dashboard and HMI views that operators actually look at.
The video demo runs two instances, one local and one on a cloud server, and starts by importing the demo data set from the source tree:
siot import < testdata/dashboard-demo.yamlThis adds a small water system: five dashboards, a couple of rules, some signal generators to produce live data, and the variables the rules act on. The home screen then shows an overview dashboard.
There are two kinds of dashboards:
- Grid: widgets arranged in columns. On a narrow screen like a phone the grid reflows to a single column.
- Canvas: a process mimic drawn on a fixed plane, with tank, pump, and valve components and links between them.
The way I like to lay things out is to build smaller canvases and then arrange them on a grid. A phone shows everything in a usable column, and a large screen shows it all at once. The demo also includes a server dashboard that shows CPU, memory, storage, and other host metrics.
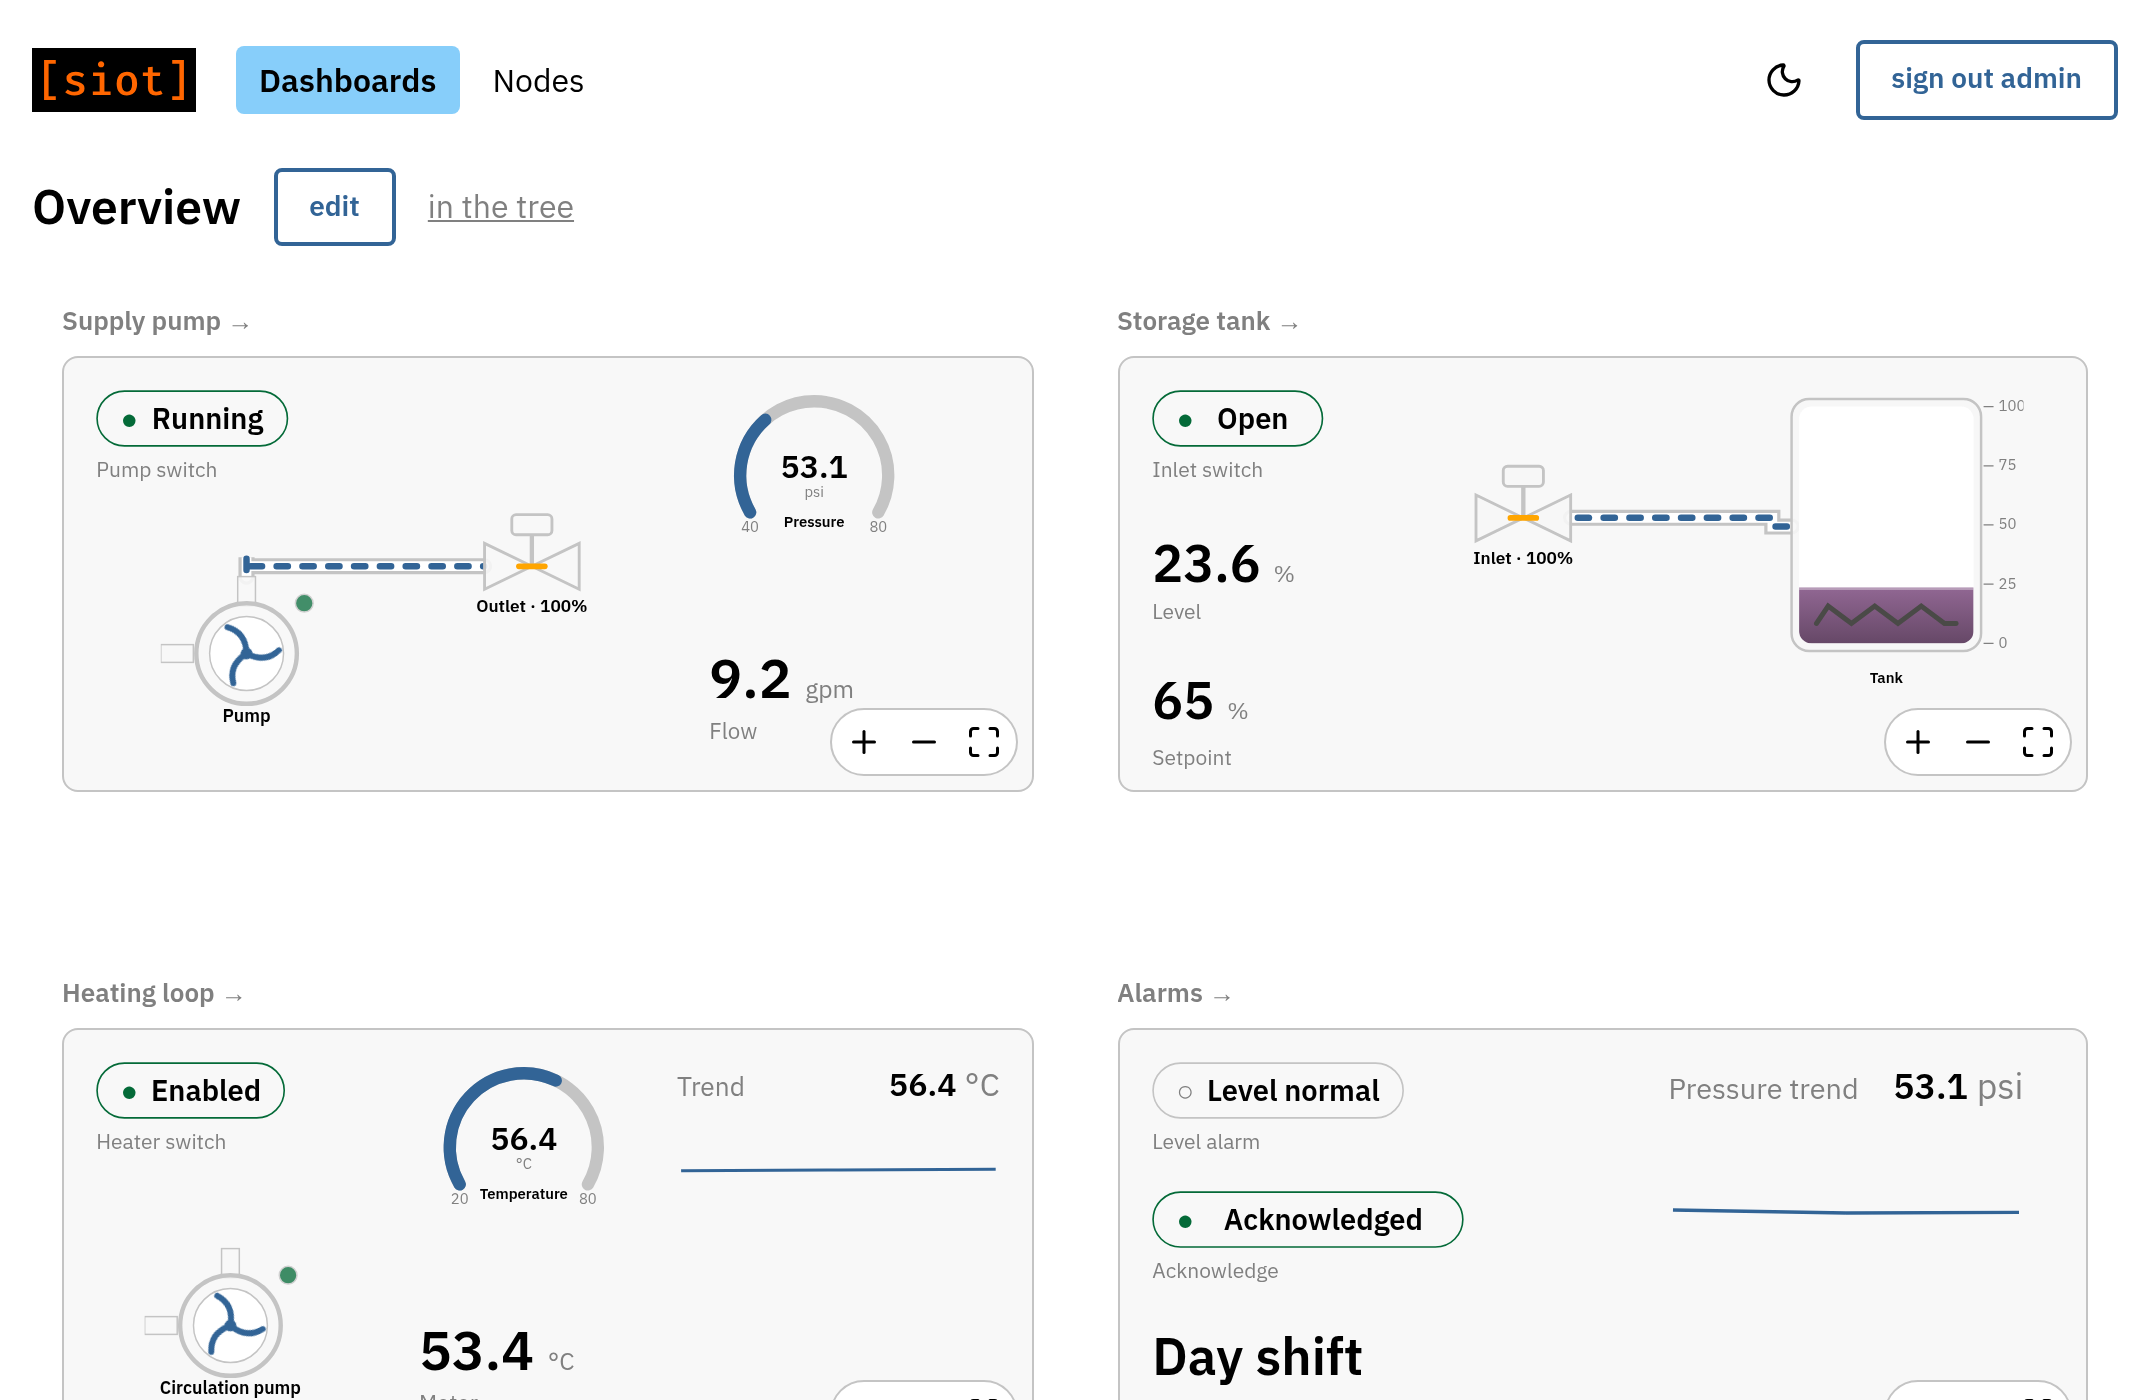
The web UI now has two views: the traditional node tree, and a Dashboards tab that lists every dashboard you can reach. Set a home dashboard on your user node, and that is what you see when you sign in.
Syncing the HMI
The interesting part comes when the local instance connects to the cloud. In the demo, the local instance enrolls with the server using an enrollment token, the server accepts it, and a minute later the two instances are connected. The demo site now shows up on the server with the same tree, and the same dashboards.
Make an operational change on the cloud, such as flipping a switch, and the local instance reflects it right away. Make it locally, and the cloud follows. This is the same real-time sync SIOT already does for data, now covering the HMI as well.
Layout syncs too. A typical scenario is configuring a system remotely while the local UI needs to show the same thing. Put the dashboard in edit mode on the server, move a widget and make it bigger, and the edge instance redraws it as you drag. Edit on the edge, and the server follows.
The reason this works is that dashboards and their widgets are just more nodes and points in the tree, and SIOT is good at synchronizing trees. Look at the raw data for a widget and you find a handful of properties: the node it is bound to, the point it reads, its position, and a few options. There is no separate dashboard database or layout file to keep in sync.
Binding a widget to a different source is a matter of picking another node. In the demo, the line pressure widget reads a random walk signal generator. Clear that and type to search, and it can read the motor temperature instead.
The dashboards guide covers building a dashboard, canvas layouts, controls, relative bindings for mirroring one dashboard under many devices, nested dashboards, and kiosk mode. We hope to do a lot more here.
The widget design took inspiration from Nautilus, Joy Automation’s open-source toolkit for building control and supervisory systems in Go. Thanks to that project for showing what a modern, code-first HMI can look like.
Thoughts, questions, feedback, let me know.